The Pi Model synthesis needs electromagnetic results for at least two frequencies to accomplish its work. It is not possible to create a Pi model if the circuit is analyzed at only one frequency. A Pi model is created for pairs of frequencies. The second frequency is determined by taking the first frequency and adding a percentage specified by the user. The second frequency then becomes the first frequency for the next pair of frequencies for which a SPICE model is generated. The synthesis continues in this way until all the frequencies have been used.
The default value for the separation percentage is 10%. In this case, a SPICE model is generated using the first frequency and the next highest frequency which provides a 10% gap. This continues until there are no more frequencies. For example, for a frequency sweep from 10 - 40 GHz with a 0.1 GHz resolution using a separation of 10%, the first few frequencies used would be 10, 11, 12.1 and 13.3 GHz.
After completing the analysis, always do a “reality check” for reasonable values. If you have bad data, the frequency may be too high or too low. If the frequency is too low, the solution may have unity S-parameters, causing a strange SPICE model. To be absolutely sure your results are good, select a different frequency band and re-analyze the circuit. You should obtain similar results between the two analyses.
You may obtain Pi Model Spice data in two different ways. The first is to specify an optional output file before executing your analysis. The second is to generate a Pi model from the response viewer. The second method has the advantage of allowing you to perform the data check mentioned above before creating the SPICE data file.
To specify a Pi Model Spice output file from the response viewer, perform the following:
- Analyze the circuit at the desired frequencies.
The job queue tab appears in the session and allows you to track the progress of the analysis. It is important to note that if your results contain more than two analysis frequencies, then multiple Spice models, one for each pair of frequencies, will be created in one file.
- When the analysis is complete, click on the Graph button on the job queue’s tool bar.
A Graph tab is opened and the response viewer is invoked with a plot of your response data.
- Click on a curve in the Curves panel to select it.
The curve is highlighted to indicate that it is presently selected. If you have multiple projects open in the response viewer, the output file is created for the project that is being used for the presently selected curve.
- Select Output ⇒ Pi Model File from the response viewer main menu.
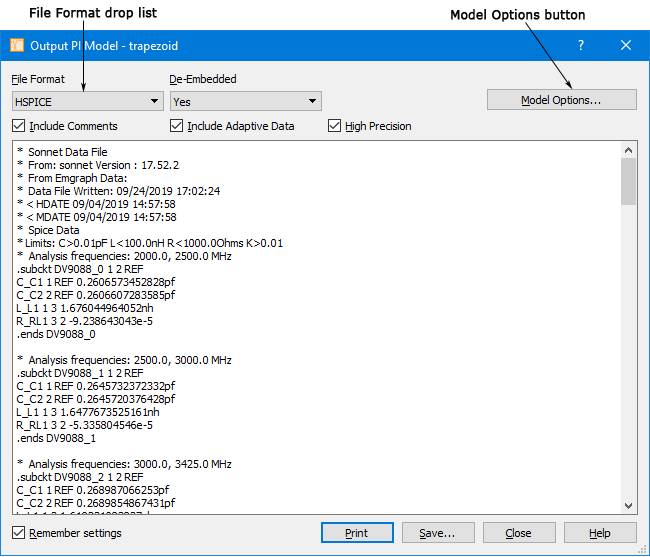
The Output Pi Model dialog box appears on your display. The contents of the output window in the Output Pi Model dialog box displays the Spice data for the Pi Model in the HSPICE format which is the default.

- Select the desired file format from the Format drop list.
If you select Spectre or PSpice as the Format (HSPICE is the default), the contents of the output window is updated.
- To change the parameters for the SPICE data, click on the Model Options button.
The Pi Model Options dialog box appears on your display. To reduce the number of lumped elements in the model, open circuit limits can be specified here as shown below.

The values are defined as follows:
RMAX: Maximum allowed resistance (ohms). The default value is 1000.0 ohms.
CMIN: Minimum allowed capacitance (pF). The default value is 0.01 pF.
LMAX: Maximum allowed inductance (nH). The default value is 100.0 nH.
KMIN: Minimum allowed mutual inductance (dimensionless ratio). The default value is 0.01.
RZERO: Resistor to go in series with all lossless inductors (resistance in ohms). Needed for some versions of SPICE. The default value is 0.0.
Separation: This is the calculation interval between the two frequencies used to generate the SPICE model specified as a percentage. The second frequency is obtained by adding the specified percentage of the first frequency to the second frequency.
All calculated component values which fall outside the allowed range specified by the user in the model options are excluded from the resulting lumped model. The RZERO entry is provided for those versions of SPICE which need inductors to have some small loss to avoid numerical difficulties. The default value of 0.0 disables this capability.
Enter the desired values for the parameters in the Pi Model Options dialog box.
- Click on the OK button in the Pi Model Options dialog box to apply the changes and close the dialog box.
- Click on the Save button in the Output Pi Model dialog box.
A browse window appears which allows you to save the data displayed in the output window. The file extension depends on which type of SPICE format you have selected.

