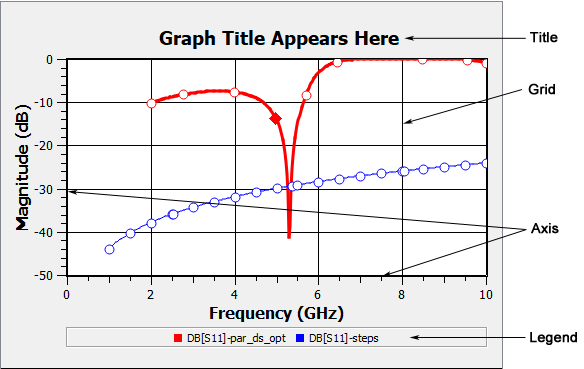
The General page of the Graph Options dialog box in the response viewer allows you to control the appearance of your plot.

Title: Enter the desired title for your plot here. This title appears above your plot in the Graph tab. The default name is the base name of the first project added to the graph.
Show Legend: Select this checkbox if you wish to display the legend in your plot. You may also toggle the display of the legend using the View - Legend command.
Show Grid: Select this checkbox if you wish to display the grid in your plot. You may also toggle the display of the grid using the View - Grid command.
Grid Weight: This drop list controls how thick the lines of your grid appear. The higher the number, the thicker the line. You may select a value from 1 to 9; 1 is the default. Note that this drop list is disabled if Show Grid is not selected.
Axis Weight: This drop list controls how thick the lines of your Axis appear. The higher the number, the thicker the line. You may select a value from 1 to 9; 1 is the default. This field affects both to the right, left, and bottom axis.