Plot Select
The Plot Select Section defines the properties used in the presently selected curve in the Curves Section. This section contains fields for frequency, phi, and theta, or any combination of the three, depending on what you are plotting over. In all cases, you may used the pull down menu to change any of these values. In addition, you may choose <Manage> which opens a dialog box allowing you to select any combination of values.
Manage Frequency/Phi/Theta
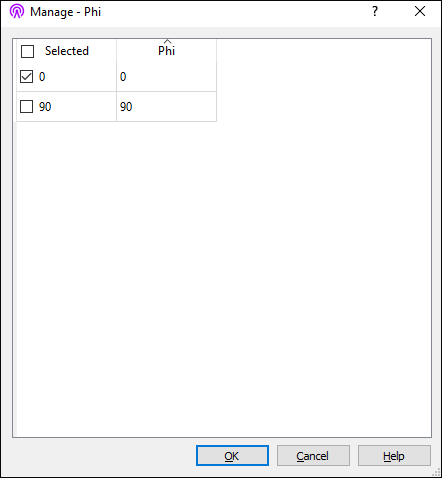
The Manage dialog box is opened when you select <Manage> from the Frequency, Theta, or Phi drop list. This dialog allows you to select any combination of frequencies, theta values or phi values from a list.
To plot a curve for a particular value, select the checkbox in front of its entry. You may select as many values as you wish or you may click on the Selected box to select all values. A curve is created for each selected value. If more than one value is selected, then the curves are added to the same group.
 .
.