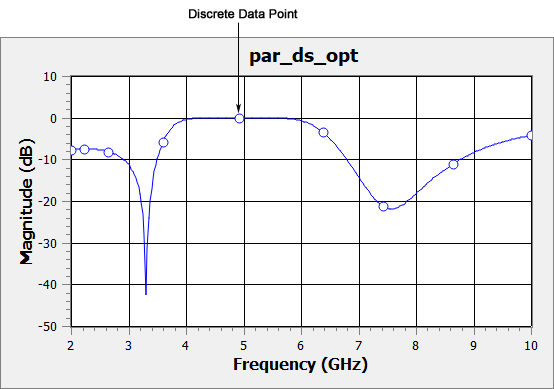
When viewing an adaptive response (ABS) in the response viewer, there are several things of which you need to be aware. The adaptive data is plotted as a line. A symbol indicating a data point only appears at the discrete frequencies at which a full analysis was executed as shown in the picture below.

When exporting data, you may choose to output only the discrete frequencies or the complete response data for the ABS analysis. To output only the discrete frequency data, unselect the Include Adaptive Data checkbox in the Export Data dialog box in the response viewer. For details, see the Output menu in the response viewer.