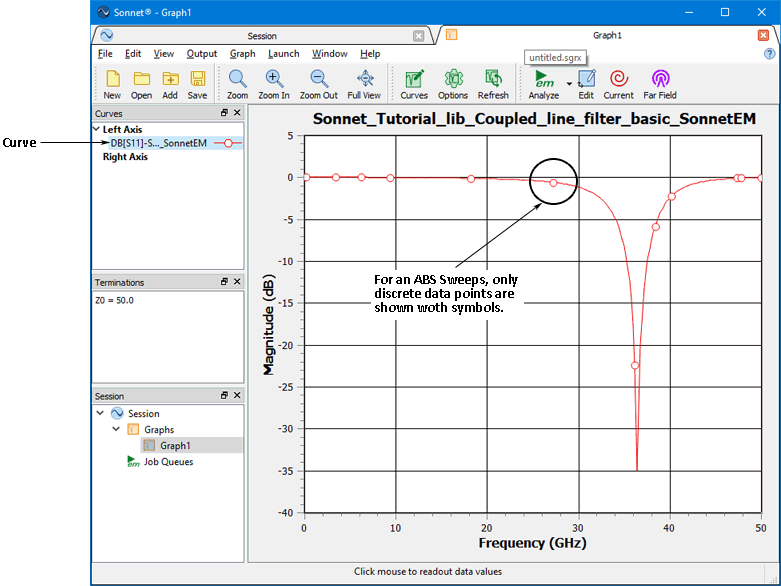
The response viewer is used to display the results from an em analysis as either a Cartesian graph or Smith chart. S-, Y- and Z-Parameters can be displayed alone or simultaneously as well as transmission line parameters. You can also display multiple curves from multiple projects on a single plot or choose to open multiple plots at the same time. In addition, the response viewer allows you to display the result of equations. There is a set of default equations or the user may define their own.
To open the response viewer, select Sonnet ⇒ Results ⇒ View Response from the main menu of the layout window. The response viewer appears on your display with the S-parameter DBS11 from your translated Sonnet project displayed as shown below. Examples of using the response viewer are available in the Getting Started Manual. You may also see Response Viewer in Help for more details.
