The Curves panel in the Graph Tab lists all of curves presently plotted in the response viewer. There are two sections: Left Axis, and Right Axis. Curves plotted on the axis are displayed in that axis list. Curves are added to your plot by selecting Graph - Manage Curves from the Graph tab main menu.
Each curve entry identifies the measurement, the project file from which the data is drawn and how the curve is represented in the plot, as shown in the example below.
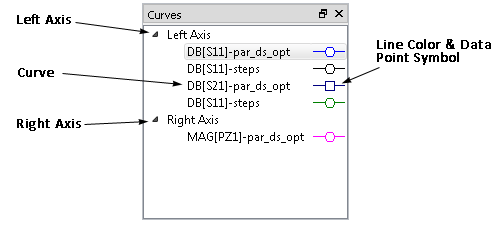
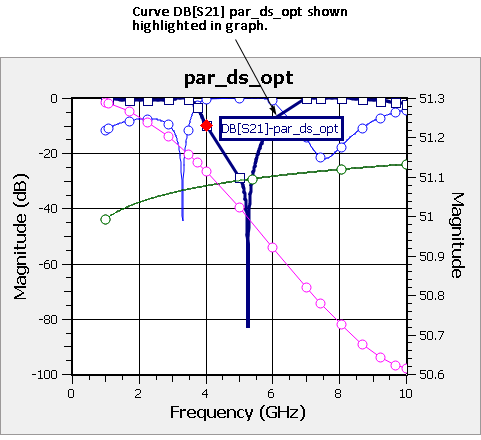
The curve identified above, DB[S21]-par_ds_opt is the magnitude in DB of S-Parameter from port 2 to port 1 in the project par_ds_opt.son. This curve is plotted on the left axis and is represented by a dark blue line. Discrete data points on the curve are shown with a square.
You may also right-click in the Curves Panel and a pop-up will appear. The pop-up is specific to what you've selected in the curves panel. For example, if a curve is selected, your choices include deleting the curve, tuning the curve, viewing the log information of the curve, and creating an output file for the selected curve. You may also open the Manage Curves dialog box from the right-click menu or double-clicking on a curve entry. In addition, you may delete a curve by selecting the curve entry and pressing the delete key.